
A worm can finish development with the same visible anatomy even when the molecular signals beneath it have changed. An aphid can do the opposite: produce a conspicuously different body form in response to its surroundings. Both cases belong to the study of gene–environment interactions. The interesting question is not whether genes or the environment “win”, but which part of a biological response changes, in which genetic background, and under which conditions.
This was a central theme of the research described on the historical Braendle Lab website. Reading that work requires three distinctions: a change in a trait, a difference between genotypes, and a difference in how those genotypes respond.
Start with the response, not the label
Phenotypic plasticity means that a genotype can produce different phenotypes in different environments. A reaction norm describes that relationship for a specified trait across specified conditions. It might describe offspring production across temperatures or the proportion of winged aphids under different crowding conditions. The trait, environmental comparison and life stage must be stated; “this animal is plastic” leaves too much unspecified.
A genotype-by-environment interaction adds another layer: the environmental effect differs between genotypes. Imagine the following entirely invented teaching example. The numbers are arbitrary trait scores, not measurements from worms or aphids.
| Genotype | Setting 1 | Setting 2 | Change |
|---|---|---|---|
| A | 2 | 4 | +2 |
| B | 4 | 2 | −2 |
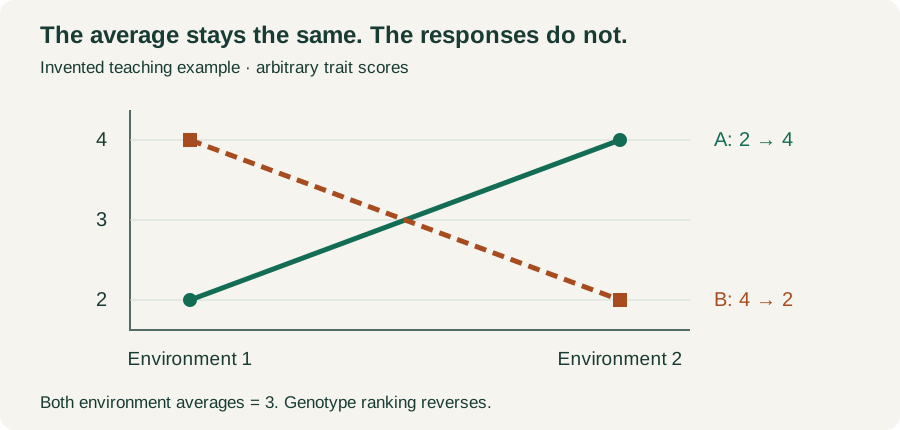
The average is 3 in both environments. Looking only at that average would suggest no environmental effect, even though each genotype responds strongly. Looking only at Environment 1 would rank B above A; Environment 2 reverses the ranking. This is why an experiment that compares a single strain in a single condition cannot answer a question about variation in reaction norms.
Crossing lines are an especially clear example, but they are not required for an interaction. Unequal responses can occur without a reversal. Conversely, if A and B both increase by the same amount, each shows plasticity while the difference between their responses is absent on that measurement scale.
Similar-looking wings can have different explanations
The pea aphid provides a concrete way to separate visible form from its control. In the 2005 study by Braendle, Friebe, Caillaud and Stern, the authors distinguished environmentally responsive wing production in parthenogenetic females from genetically controlled wing variation in males. They then asked whether the male wing locus, aphicarus, was genetically linked to differences in female wing production.
Clones with different aphicarus genotypes differed in their propensity to produce winged offspring. That result connected two routes to superficially similar forms. It did not make “winged versus wingless” a single, context-free genetic switch for every sex and generation. The accompanying electronic appendix belongs with the paper when checking its experimental context.
The useful reading habit is to ask what was compared: sexes, generations, clonal genotypes, environmental treatments, or some combination. A result about one of these comparisons cannot silently stand in for all the others.
A stable outcome can hide variation underneath
Plasticity is only one possible response to changing conditions. Developmental robustness concerns the persistence of an outcome despite perturbation. Robustness and plasticity therefore need not be opposites at every biological level: a stable final pattern may coexist with changes in the processes that produce it.
The archived research programme treated the relationship between environmental sensitivity and developmental precision as a research question. Its discussion of Caenorhabditis connected cell-level mechanisms with organism-level traits rather than assuming that a visibly unchanged animal had undergone no biological response.
A separate 2010 mutation-accumulation study examined vulval development in lines derived from four wild isolates of C. elegans and C. briggsae. Mutational accumulation increased developmental defects and variants, but the kinds and frequencies of variation depended on genetic background. The experiment tested mutational sensitivity, not simply an environmental treatment. Its relevance here is that an apparently conserved developmental outcome does not imply that all underlying systems respond identically when perturbed.
What to check before accepting a broad conclusion
Begin with the outcome being measured. A count of offspring, a signalling measurement and a cell-fate pattern describe different levels of biology. An environmental response in one does not automatically establish the direction or size of a response in another.
Next, look for the comparison that could distinguish the explanations. Multiple genotypes under multiple conditions are needed to compare their responses; repeated measurements help distinguish a pattern from sampling noise. The scale also matters: equal absolute changes and equal proportional changes are different claims.
Finally, separate an observed response from an adaptive explanation. A trait changing with its environment does not by itself demonstrate that the change improves fitness. That requires evidence about consequences in the relevant setting. Likewise, a laboratory result does not establish how often those conditions occur in nature.
The reward for making these distinctions is a more informative question. Instead of asking whether a trait is “genetic or environmental”, ask which genotypes were compared, what changed around them, which outcome was measured, and whether their responses differed. Those details are where the biological explanation begins.
This independent explanatory article discusses historical research. It does not represent the original laboratory or report a new experiment. The existing guide to the 2014 species-diagnosis paper and its correction addresses a different question: how closely related species were distinguished.